Interactive Global Map
Explore the spatial relationships between ocean oxygenation patterns, whale distributions, and marine biodiversity
Map Layers
Toggle data layers to explore patterns
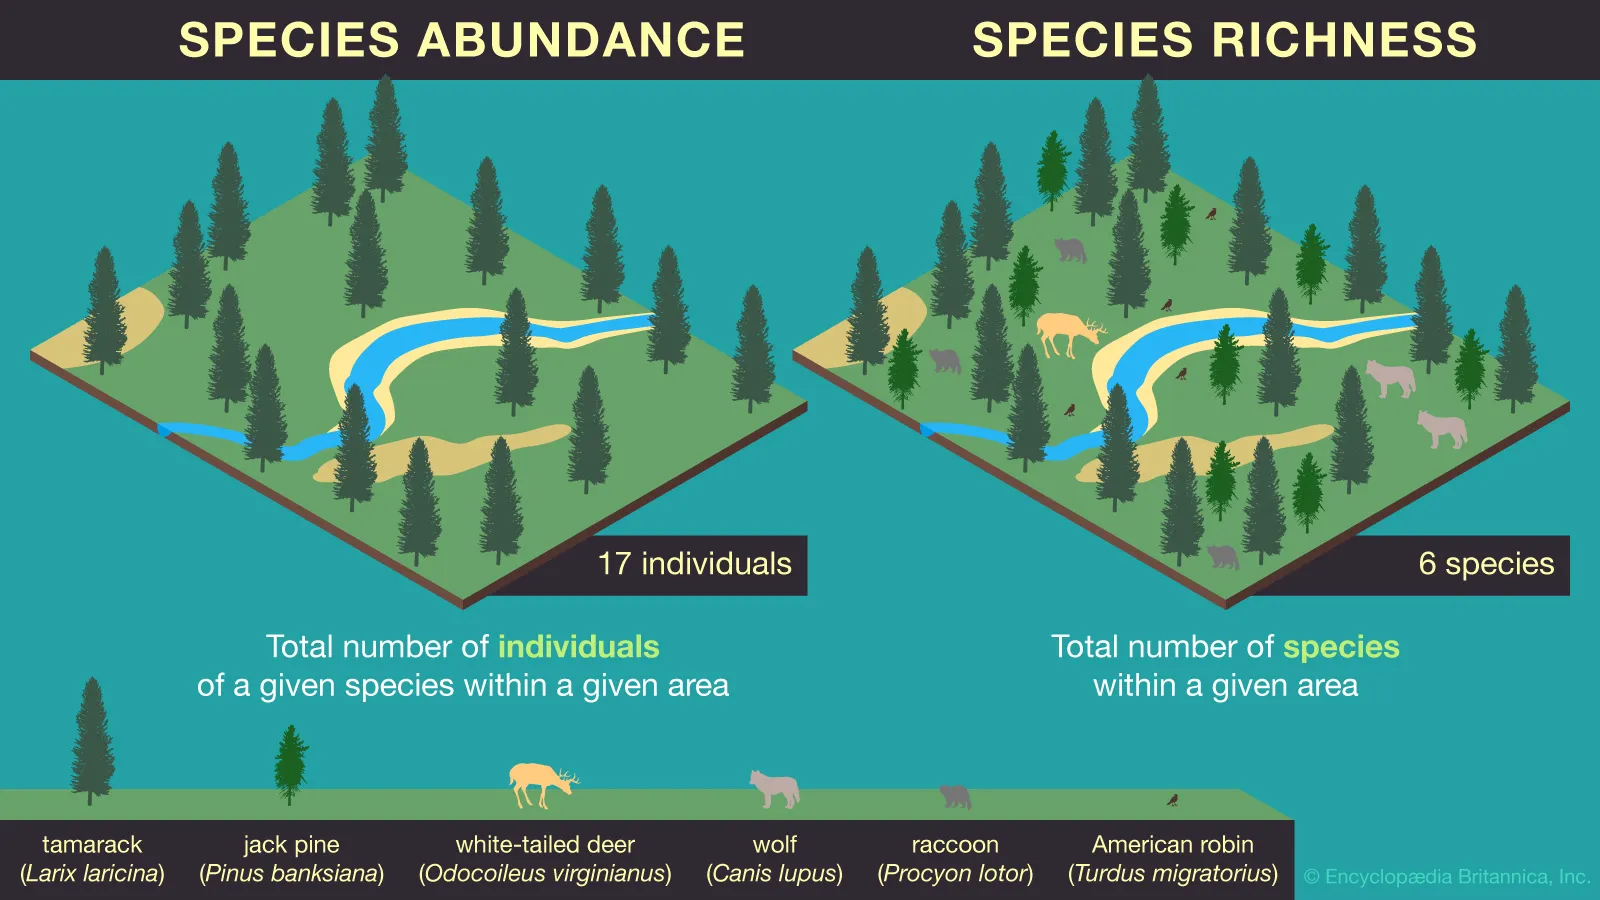
Marine Biodiversity Hotspots
Global distribution of species richness showing areas of high marine biodiversity concentration.
100%
Global Ocean Map
Interactive visualization of ocean oxygenation and whale diversity patterns
Map Information
Key Observations
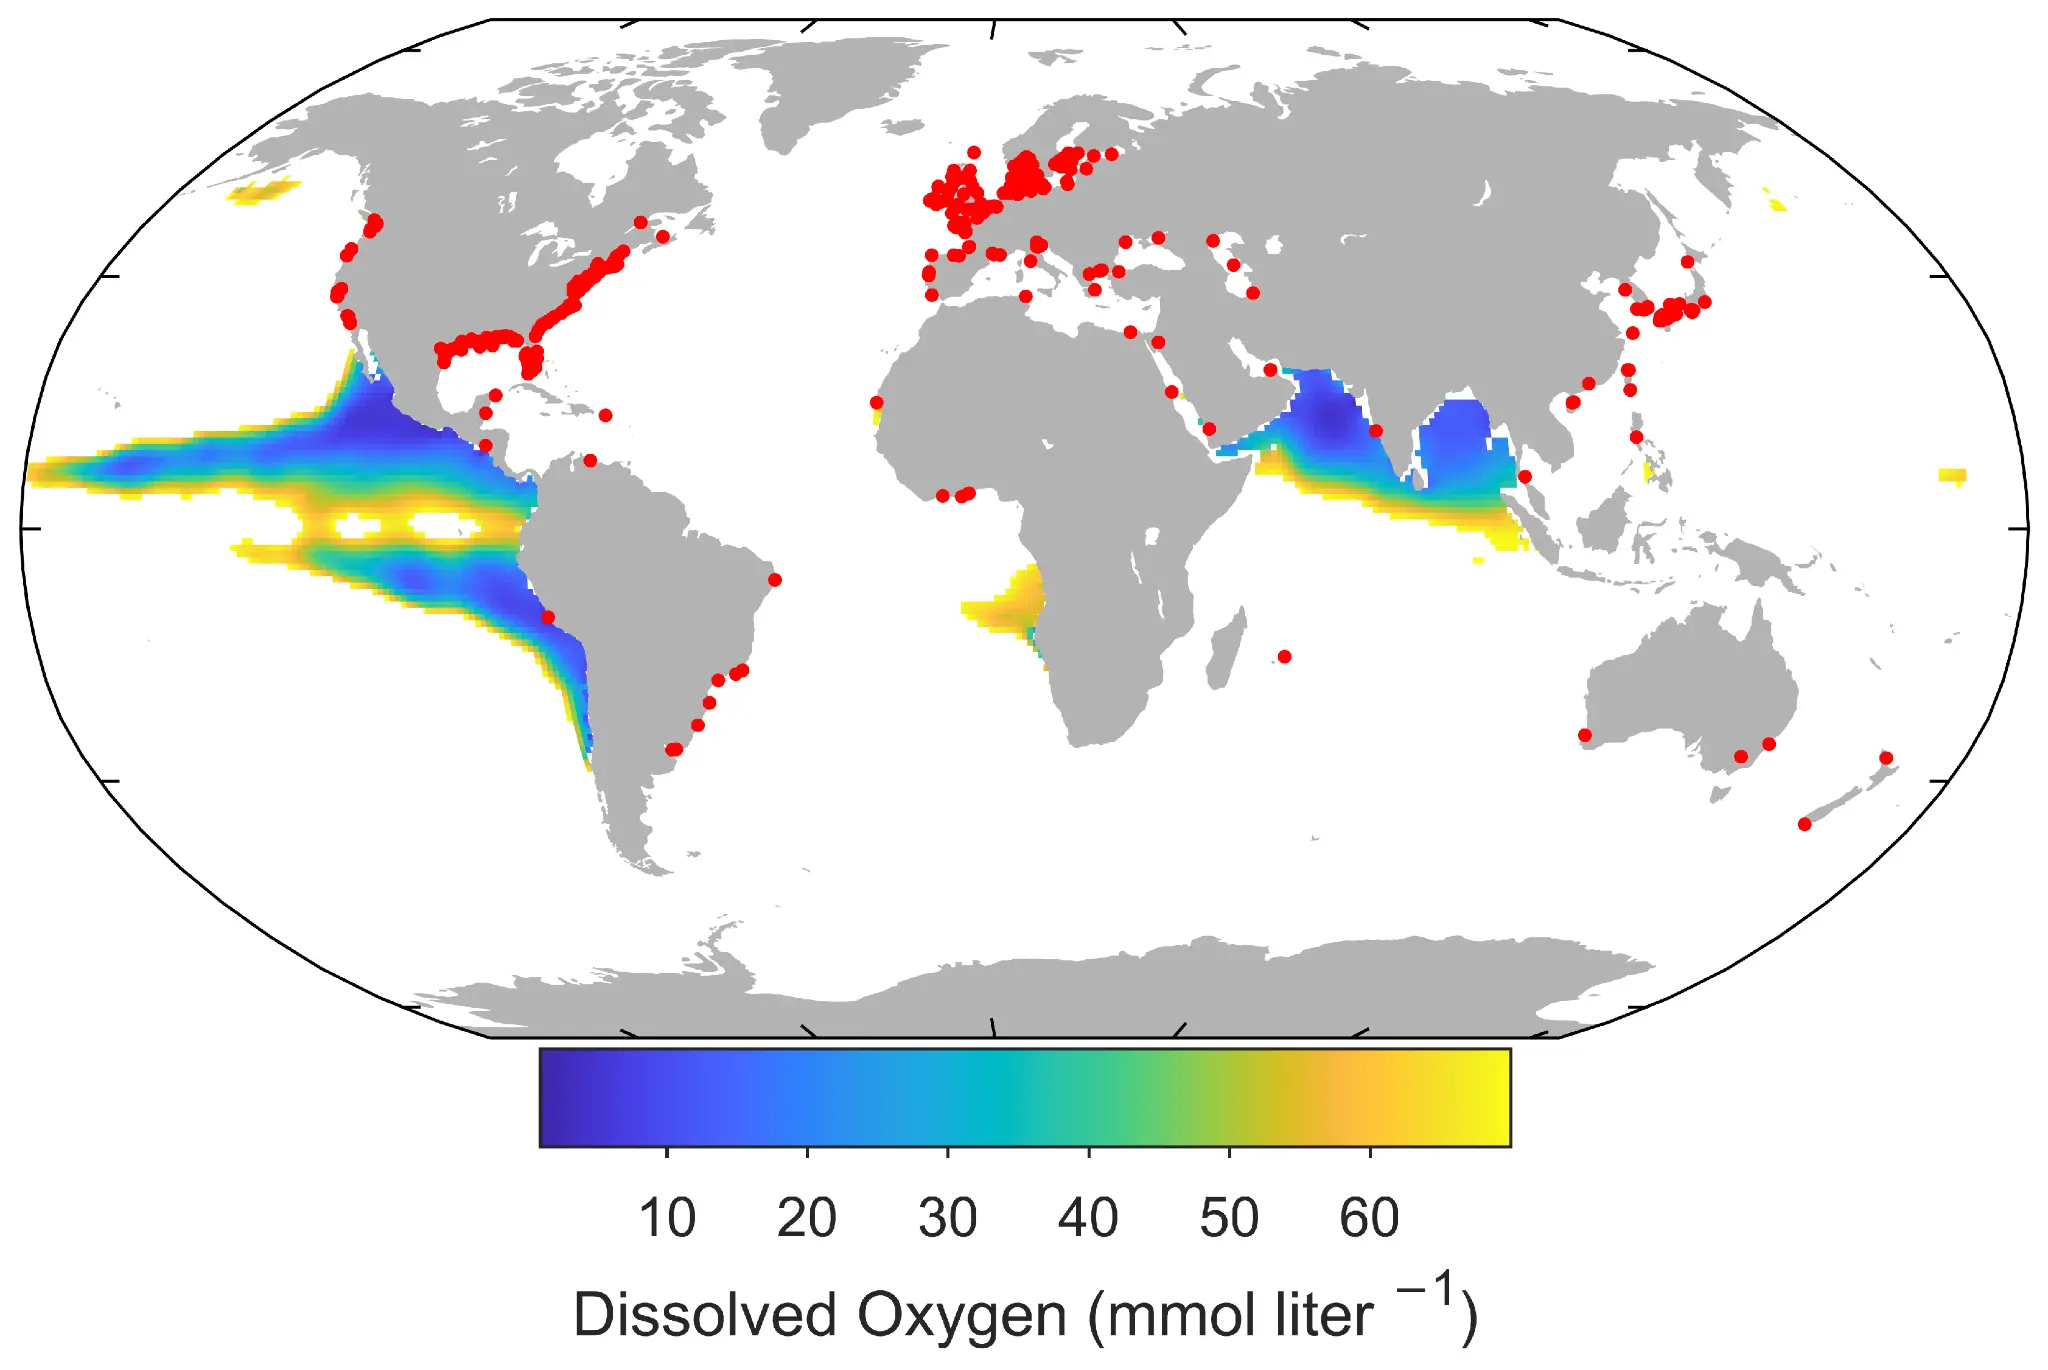
- • High species richness correlates with productive upwelling zones
- • OMZs are expanding in tropical and subtropical regions
- • Whale migration routes avoid low-oxygen regions
- • Coastal areas show complex oxygen dynamics
Research Implications
- • Habitat compression threatens deep-diving species
- • Climate change is altering historical distribution patterns
- • Conservation efforts must account for oxygen dynamics
- • Monitoring oxygen levels is critical for biodiversity
OMZ Vertical Structure
Depth profiles showing oxygen depletion zones
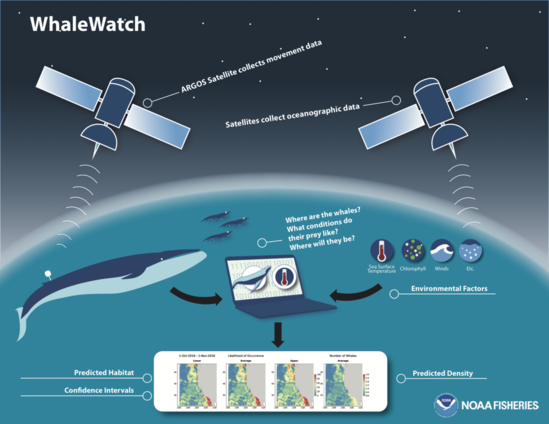
Whale Monitoring Data
Observation networks tracking whale populations